
K-Means Clustering Explained
How machine learning finds structure in unlabeled datasets

Ever stared at a huge pile of data and wished you could automatically sort it into meaningful groups? Whether you're a business trying to understand your customer types or a biologist classifying species the problem is often the same how do we find natural groupings in unlabeled data?
Enter K-Means Clustering. An algorithm that groups unlabeled data into K groups. It's one of the easiest, yet most powerful, algorithms in the world of unsupervised learning. In contrast to supervised learning (where you have "answers" or labels to train your model), K-Means helps you find patterns in data that has no predefined categories.
Imagine You Have a Bunch of Dots...
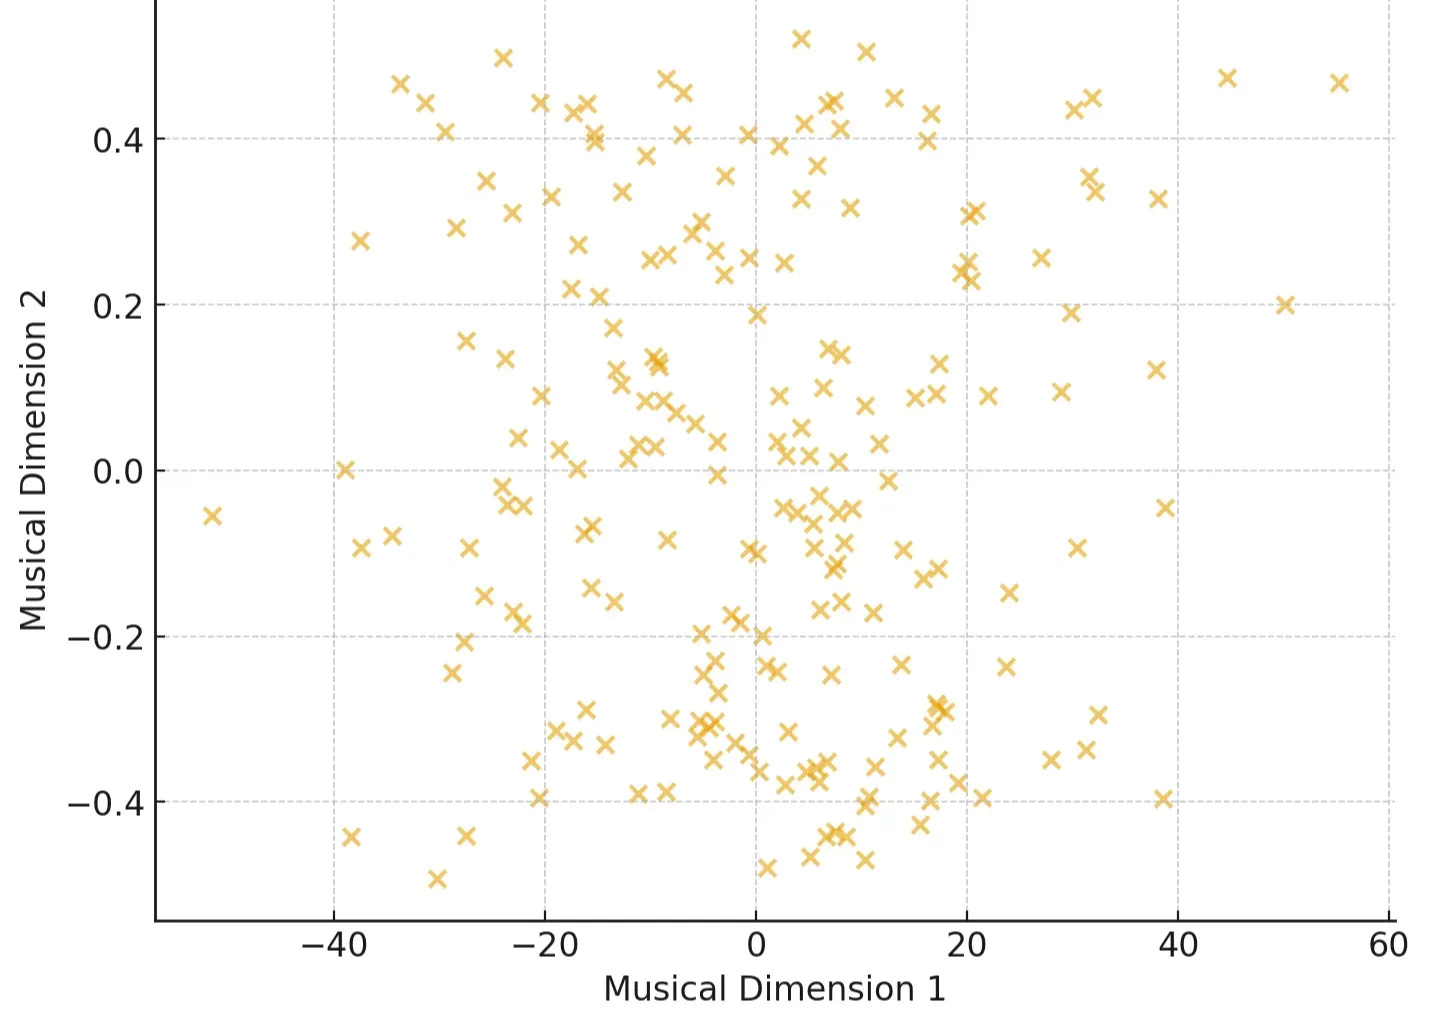
Example 1: Music Recommendation
Streaming services like Spotify represent each song as a data point, with features like:
Tempo (beats per minute)
Energy (intensity of the track)
Danceability (how suitable it is for dancing)
Valence (positiveness of the mood)
At first glance, it's just a scatter of songs in high-dimensional space. But by clustering, we can uncover natural "playlists" like High-energy workout tracks, Chill acoustic vibes , Melancholic indie ballads etc.
Now the system can recommend songs you didn’t even know you’d like by finding others in the same cluster.
Example 2: Image Compression
Think of pixels in an image. Each has three values (Red, Green, Blue). K-Means groups similar colors together, replacing thousands of shades with just a few representative ones. The result? Smaller file size, minimal visual loss.
The 5 Steps of K-Means
Step 1: Pick How Many Groups (K)
The first, and often trickiest, decision in K-Means is choosing K the number of clusters (groups) you want to find. While this can be tricky, data scientists often use methods like the "Elbow Method" to find the optimal number For now, let's just pick a number. Say we want to find 3 distinct playlists, so K=3.
Step 2: Randomly Place K "Centroids"
Next, the algorithm randomly picks K points in your data space. These are called centroids, and they act as the initial centers of your clusters.
Think of them as “hypothetical playlist” we’ll refine.
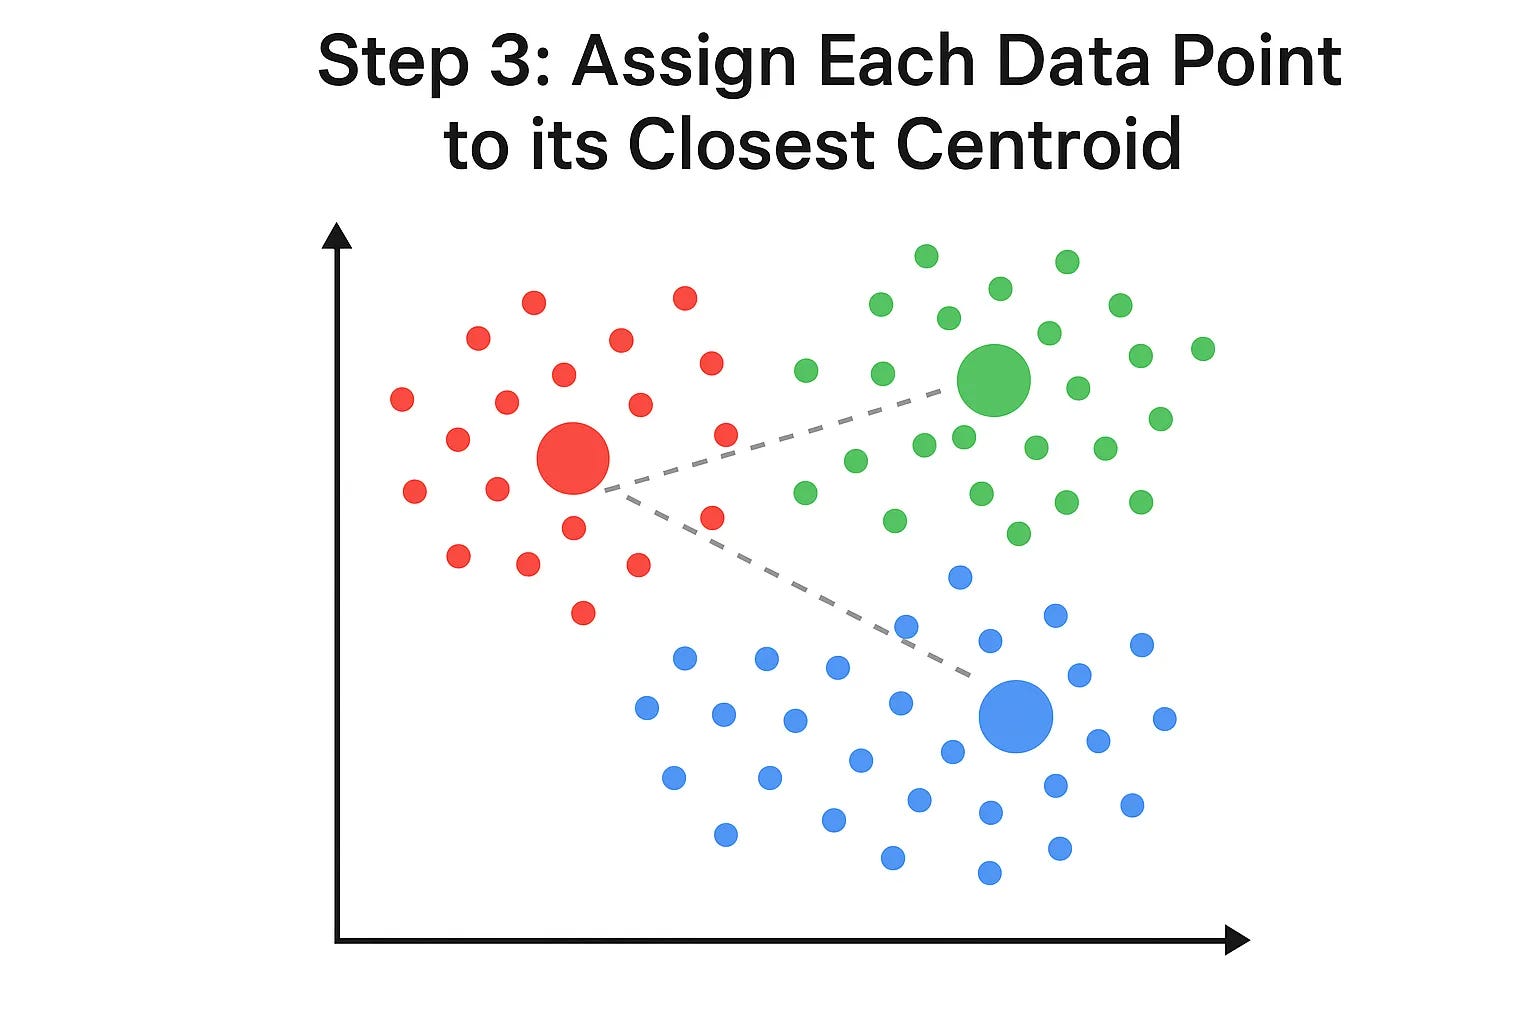
Step 3: Assign Each Data Point to its Closest Centroid
Now, for every single data point , the algorithm calculates which of the K centroids is closest to it. Once it figures that out, it "assigns" that data point to that centroid's cluster. We can visualize this by coloring the points.
To figure out which centroid a point belongs to, K-Means usually uses Euclidean distance(Default in sklearn). For two points, say your data point (x1,y1) and a centroid (x2,y2) the distance is:
So a high-energy, high-tempo song may get assigned to the “Workout Tracks” cluster, while a slow, mellow acoustic song falls into the “Chill” cluster.
See how the colors divide the space? Each point is now part of the cluster whose centroid it's closest to.
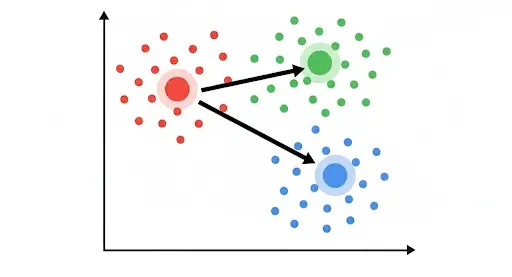
Step 4: Move the Centroids to the Center of Their Assigned Points
This is where the "means" part of K-Means comes in. After all points are assigned, each centroid moves to the average (mean) position of all the data points currently assigned to its cluster. It literally repositions itself to be the true center of its group.
In math terms, if a cluster has points (x1,y1),(x2,y2).....(xn,yn) the new centroid is simply:
Example (Image Compression): If you grouped a bunch of slightly different shades of blue pixels together, the centroid for that group would move to the average blue color of all those pixels. Or think of it like a group of friends agreeing on a café: they’ll keep shifting until they settle on the most central one for everyone
Notice how the centroids have shifted? This movement is crucial because it makes them better representatives of their clusters.
Step 5: Repeat Steps 3 & 4 Until Converged
The magic happens as we repeat the last two steps:
Re-assign points: With the new centroid positions, some points might now be closer to a different centroid. So, the algorithm re-calculates distances and re-assigns points to their new closest centroid.
Think of it like adjusting a playlist until it best represents the songs inside it.
Re-calculate centroids: Each centroid then moves again to the center of its newly assigned points.
This process continues, back and forth, refining the cluster assignments and centroid positions.
The algorithm stops when the centroids no longer move significantly, or when the assignments of points to clusters don't change anymore. This is called convergence.
The Final Clusters
Once the algorithm converges, you're left with your K distinct clusters. Each centroid now perfectly represents the center of its group, and every data point belongs to the cluster it's most similar to.
Example (Music Playlists):
🔴 Workout Anthems (fast, high-energy tracks)
🟢 Chill Acoustic (soft, relaxing songs)
🔵 Indie Ballads (slower, emotional tracks)
Here is a quick python example to implement K-means clustering
from sklearn.cluster import KMeans
import numpy as np

# Example dataset: [tempo, energy]
songs = np.array([
    [120, 0.9],   # upbeat EDM track
    [70, 0.2],    # slow acoustic
    [140, 0.85],  # workout anthem
    [90, 0.4],    # chill indie
    [110, 0.7]    # pop track
])

# Run K-Means with 2 clusters
kmeans = KMeans(n_clusters=2, random_state=42, n_init=10)
kmeans.fit(songs)

# Cluster assignments
print("Cluster labels:", kmeans.labels_)
print("Centroids:", kmeans.cluster_centers_)
When Not to Use K-Means
K-Means is powerful, but not perfect. Be cautious if:
Your data has weird shapes (non-spherical clusters).
There’s lots of noise or outliers.
Different features are on different scales (always standardize first)
Why is K-Means So Popular?
Simplicity: It's easy to understand and implement.
Efficiency: It's generally fast, even with large datasets.
Versatility: It's used in countless applications, from market segmentation and document clustering to image compression and anomaly detection.
K-Means Clustering is a fantastic tool for making sense of unorganized data, revealing hidden patterns, and turning raw numbers into actionable insights. It's truly a little bit of magic for data analysts and machine learning practitioners
Resources:
Visualizing K-Means Clustering : Click here