
Law of Large Numbers Explained
A Beginner’s Guide to the Law of Large Numbers

Ever wondered why casinos always run in profit or how polls can predict elections with just a few thousand people? The secret lies in the Law of Large Numbers
This simple observation is at the heart of one of the most important ideas in statistic. It’s the simple but profound idea that brings predictability to a random world, and it explains everything from how insurance companies make money to why casinos have a guaranteed business model.
What is the Law of Large Numbers?
The Law of Large Numbers states that:
“as the size of a sample increases, the average of the observed values will get closer to the expected (theoretical) value”
In plain words:
The more trials we run, The closer our results will match what probability theory predicts.
This law assures us that randomness balances out when we look at the bigger picture.
Coin Toss
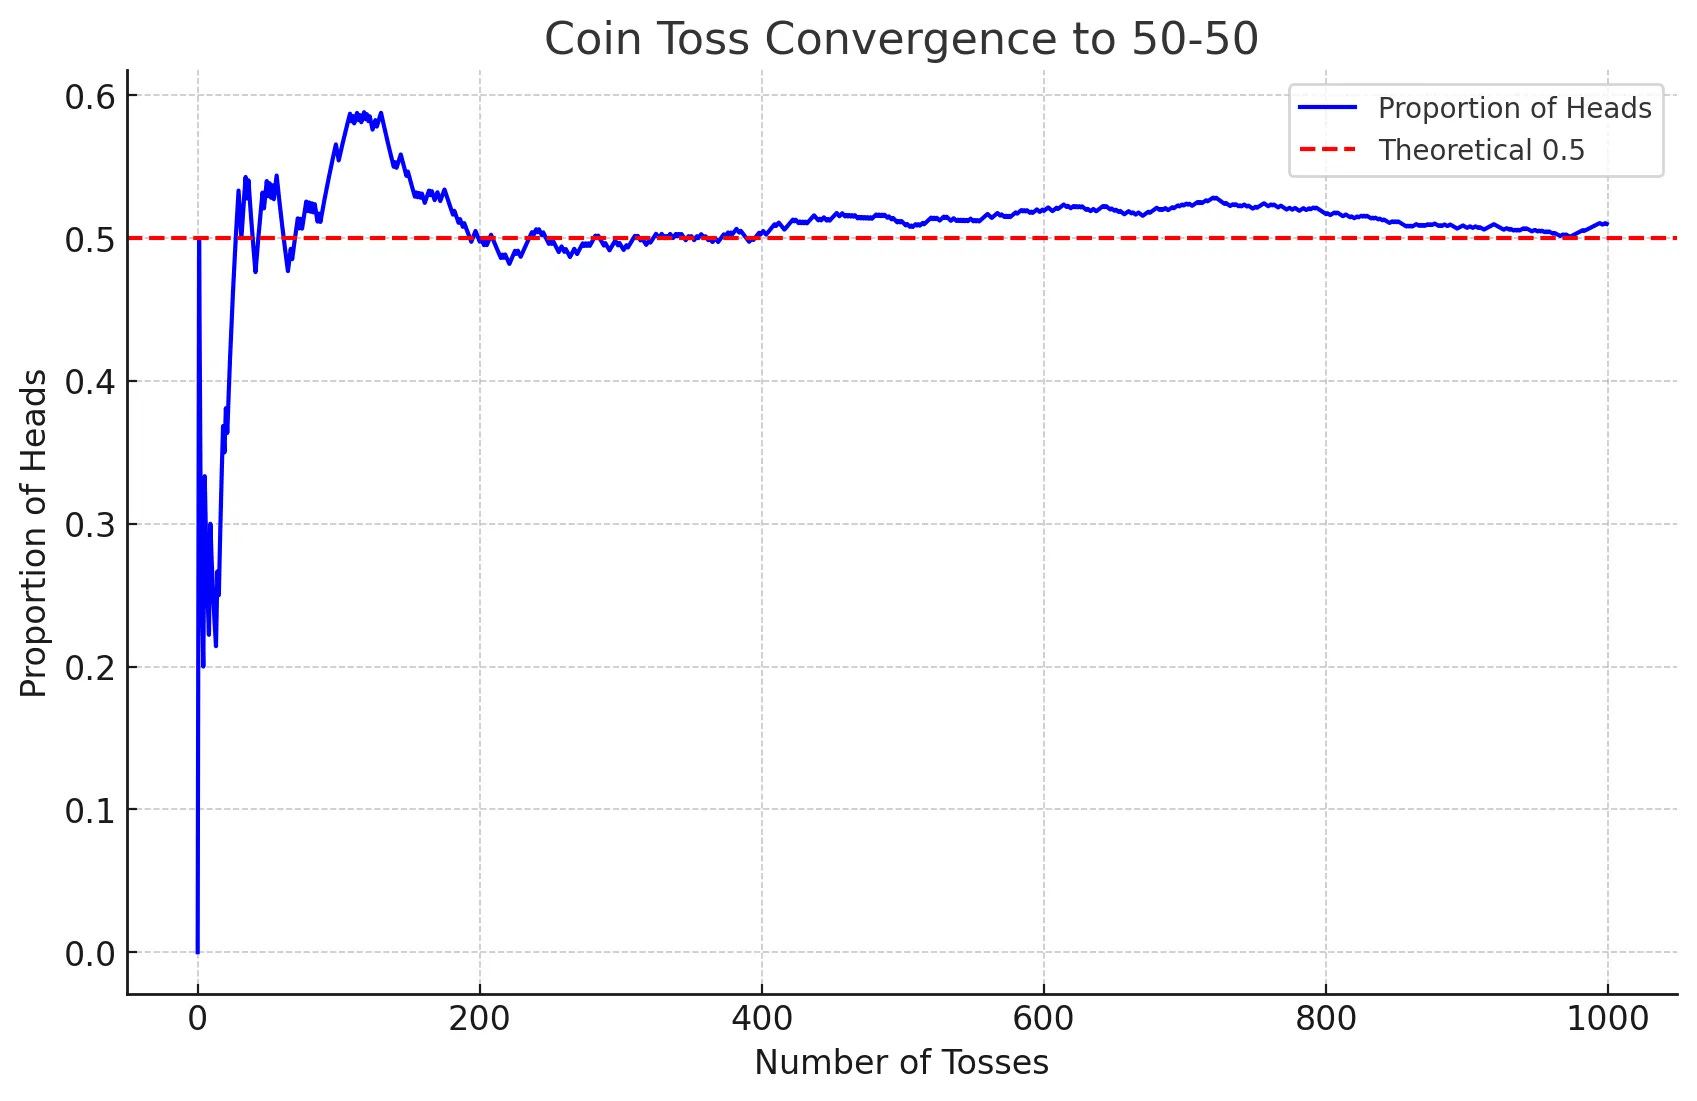
Theoretical expectation: For a fair coin, the probability of heads is 0.5 (50%).
Small sample: If you flip the coin 5 times, you might get something like: H, H, T, H, T → 3 heads out of 5 (60%). That looks unfair.
Large sample: Flip it 1000 times. You might get 502 heads and 498 tails. That’s 50.2% heads much closer to 50%.
The more you flip, the more the ratio settles near 50%.
As you can see, the results are wild and erratic at the beginning, but as the number of flips (the "large number") increases, the line stabilizes and converges on the 50% mark. The initial "lumpiness" of randomness gets smoothed out over time.
Conditions for LLN:
The trials must be independent.
The trials must be identically distributed.
Mathematically, the Law of Large Numbers is written as:
Mathematically, the Weak Law of Large Numbers is written as:
This looks intimidating, but it simply says that the probability (P) that your sample X̄ₙ is different from the true average (μ) by more than a tiny amount (ϵ) gets closer and closer to zero as your sample size (n) gets bigger.
This convergence isn't just a neat trick it's a mathematical certainty. Let's break down the formulas using a new example.
Song Popularity on a Playlist
Suppose a song has a 60% chance of being liked by listeners. This 60% (or 0.6) is our expected value (μ), the true long-term average we expect to see.
Let's assign a value of 1 if a person likes the song and 0 if they don't.
The rule for the expected value is:
So the true probability, or expected value, of liking the song is 60%. Now let's see what happens when we start collecting data. The formula for the sample average X̄ₙ is:
This just means we add up all the individual outcomes (Xi) and divide by the number of listeners (n).
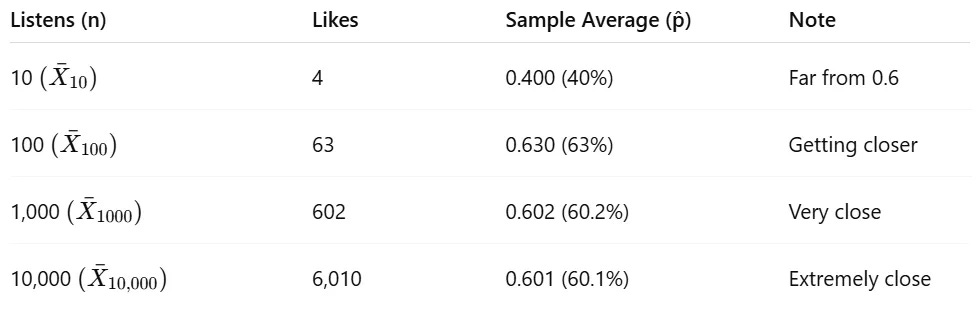
Notice that as n grows, our sample average X̄ₙ gets closer and closer to the expected value E[X]=0.6
Example: The Casino
So, how does this make casinos rich? Every game in a casino is designed to give the house a slight statistical advantage. Let’s look at American roulette.
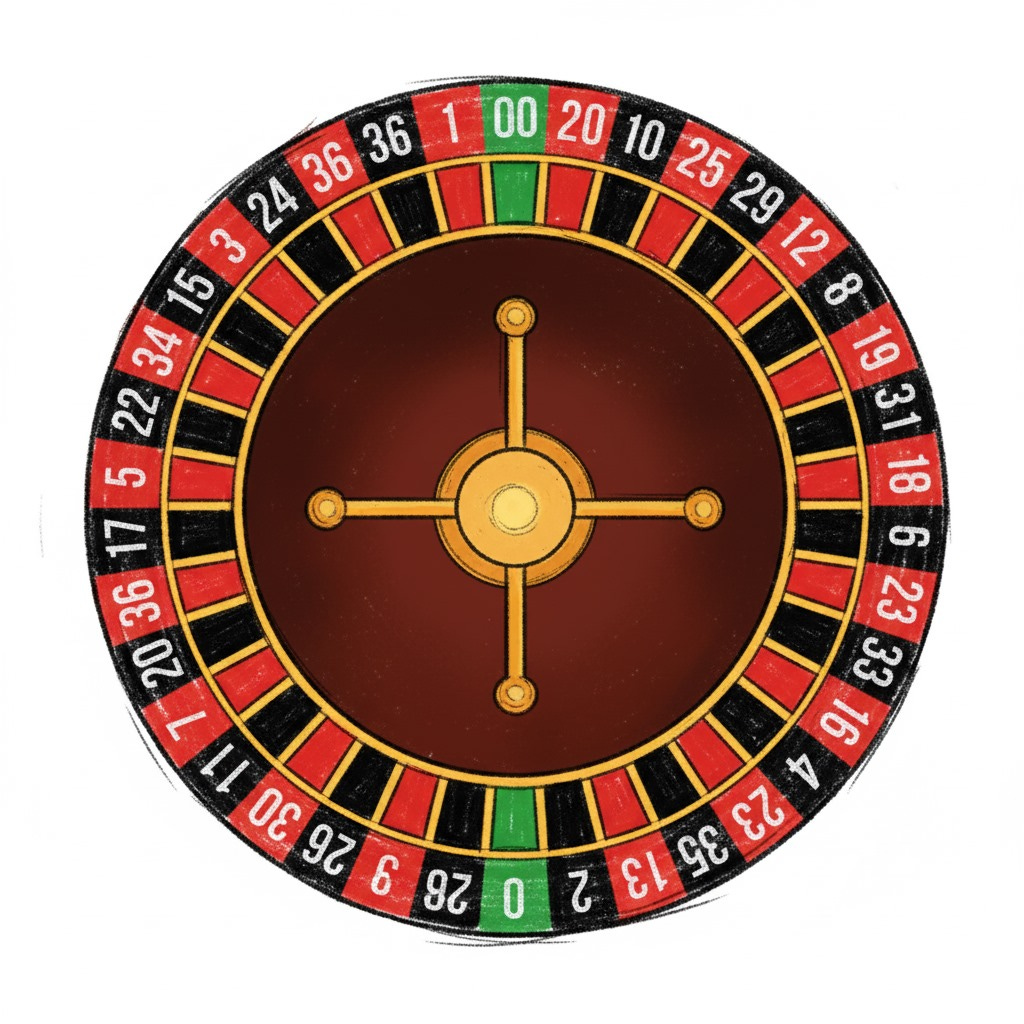
The wheel has 38 pockets: 18 red, 18 black, and 2 green. If you bet on red, your chance of winning is 18/38 which is about 47.4%. The casino's chance of winning is 20/38, or 52.6%.
A Single Player (Small Numbers): You might place 10 bets on red and win 8 of them. It's unlikely, but possible. You walk away with a profit because in the short term luck can overcome probability.
The Casino (Large Numbers): The casino isn't just taking your 10 bets. It's taking millions of bets every day from thousands of players. Their sample size is enormous. The Law of Large Numbers guarantees that over these millions of bets, their actual win rate will get incredibly close to their theoretical 52.6% advantage.
That small, consistent edge when applied to a massive number of trials becomes a predictable and highly profitable source of revenue. The casino isn't gambling it's just waiting for the math to work itself out.
The Gambler's Fallacy
It's crucial not to misunderstand what the Law of Large Numbers is saying. This leads to a common mistake known as the Gambler's Fallacy.
The Fallacy: "The roulette wheel landed on red five times in a row. Black is due to hit next to balance things out"
The Reality: The roulette wheel has no memory. Each spin is an independent event. The probability of landing on black is always the same (18/38), regardless of what happened in the past.
The Law of Large Numbers does not say that past events will be "corrected." It simply says that over a huge number of future spins, the impact of that weird streak of five reds will be drowned out and become statistically insignificant.
Weak Vs Strong Law of Large Numbers
Imagine a student who on average scores 70 marks in exams.
Weak Law: If you look at their average after a few exams (say 3 or 5), it will probably be close to 70 but not always. Maybe it’s 65, maybe 75, maybe 72. The more exams you consider, the closer it tends to get.
Strong Law: If you keep looking at their average across all exams in their lifetime, the average will eventually settle right at 70 and it won’t drift away anymore.
Weak Law = The average is usually close if you check from time to time.
Strong Law = In the very long run, the average locks onto the true score and stays there.
LLN in Our Daily Lives
The Law of Large Numbers doesn't just power casinos, it's a hidden engine behind many modern systems.
Scientific and Political Polling: How can a poll of just 1,000 people accurately predict the opinion of millions? Pollsters rely on the LLN. While a small sample might be skewed, a carefully selected sample of a large enough size will have an average opinion that gets very close to the entire population's true opinion.
A/B Testing in Tech: When companies like Netflix, Amazon, or Google test a new feature (like a button color or a new headline), they show it to thousands or millions of users. They don't care if a few users have a weird reaction. They trust the Law of Large Numbers to show them that after a massive number of trials, the version with the genuinely better average click-rate will become clear.
Conclusion
The Law of Large Numbers is the bedrock of the modern data driven world. It gives us the confidence that while individual events can be random and chaotic, the collective behavior of many events can be remarkably stable and predictable.
It tells us that the average of our samples will get closer to the true average. Not only do averages stabilize, but they also follow a beautiful pattern one that looks suspiciously like a bell curve. That’s the Central Limit Theorem one of the most powerful and beautiful ideas in statistics.
Check out the Central Limit Theorem next : Link