
Star vs Snowflake vs Galaxy schema
A Guide to Star, Snowflake, and Galaxy Schemas

Helloo data enthusiasts! Welcome to another blog from Data Pe Charcha.
This time, we are going to dive into the architecture that can make or break your entire data strategy: the schema , and I know ‘schema’ sounds incredibly technical. But understanding this one concept is the secret key that unlocks everything else in analytics . Getting the schema right is the difference between a data swamp and a data goldmine. It all comes down to a simple idea: organization.
Every business runs on two different kinds of data systems: one that’s built for putting information in (like recording a sale), and another that’s built for getting insights out. The bridge between these two worlds is the data warehouse, and its structural integrity is defined by its schema.
But you might ask, why can’t we just use the regular databases that run our daily operations?
Standard relational databases (OLTP systems) are designed for speed and efficiency in handling daily transactions, like recording a sale or updating inventory. To do this, they normalize data by splitting it across many tables.
This structure is terrible for analytics. Asking a simple business question would require joining dozens of these tables, making queries incredibly slow. Data warehouses (OLAP systems) using schemas like Star or Snowflake are the opposite, they are specifically structured to read and analyze huge volumes of historical data very quickly. Using a transactional database for business intelligence is like using a race car to haul furniture it’s the wrong tool for the job.
For anyone diving into data warehousing, business intelligence, or analytics, three names pop up constantly: Star, Snowflake, and Galaxy.
Let’s break them down from the ground up.
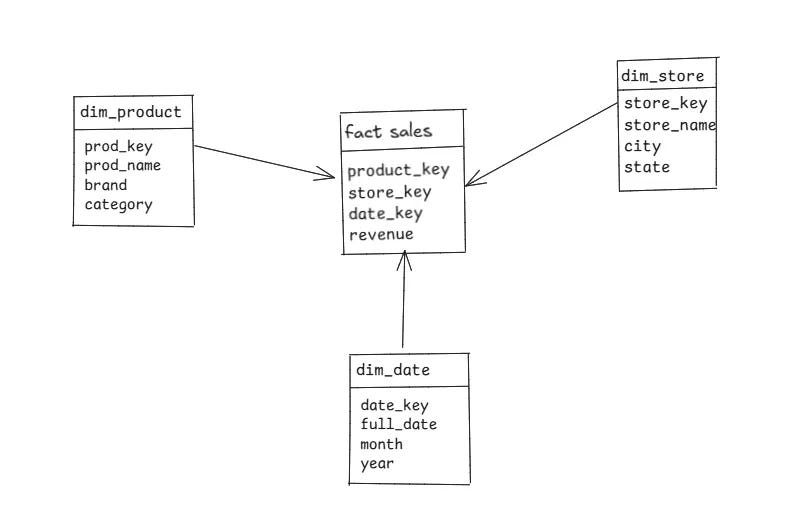
The Star Schema
The Star Schema is the most common and straightforward approach. Picture a star: a central point with rays stretching outwards. Business Intelligence tools like Tableau or Power BI love Star Schemas because they can easily understand the relationships and generate insights quickly.
The Core (The Star’s Center): At the heart is the Fact Table. This table holds the primary quantitative data or “measures” you want to analyze like revenue. It also contains keys that link to the surrounding tables.
The Points (The Star’s Arms): Surrounding the fact table are the Dimension Tables. These tables provide the context the “who, what, where, when” for your facts. They contain descriptive attributes like product_name, product_category, city , or date. In a Star Schema, these dimension tables are denormalized, meaning they keep related information together in a single table to avoid complex joins.
Why use a Star Schema?
Simple & Fast: The simple structure means queries are easy to write and run incredibly fast because they require fewer joins.
BI Tool Friendly: Business Intelligence tools like Tableau or Power BI love Star Schemas because they can easily understand the relationships.
Major Drawback
Data Redundancy: Because dimensions are denormalized, you might have repetitive data (e.g., the category name “Electronics” repeated for every electronic product). This can take up more storage space.
Best For: Most data marts and straightforward data warehouses where query speed and ease of use are the top priorities. When in doubt, start with a Star.
The Snowflake Schema
The Snowflake Schema is an evolution of the Star Schema. It gets its name because its diagram looks like a complex, branching snowflake. The main difference? It normalizes the dimension tables.
Normalization is just a fancy word for breaking down large tables into smaller, more specific ones to reduce data redundancy.
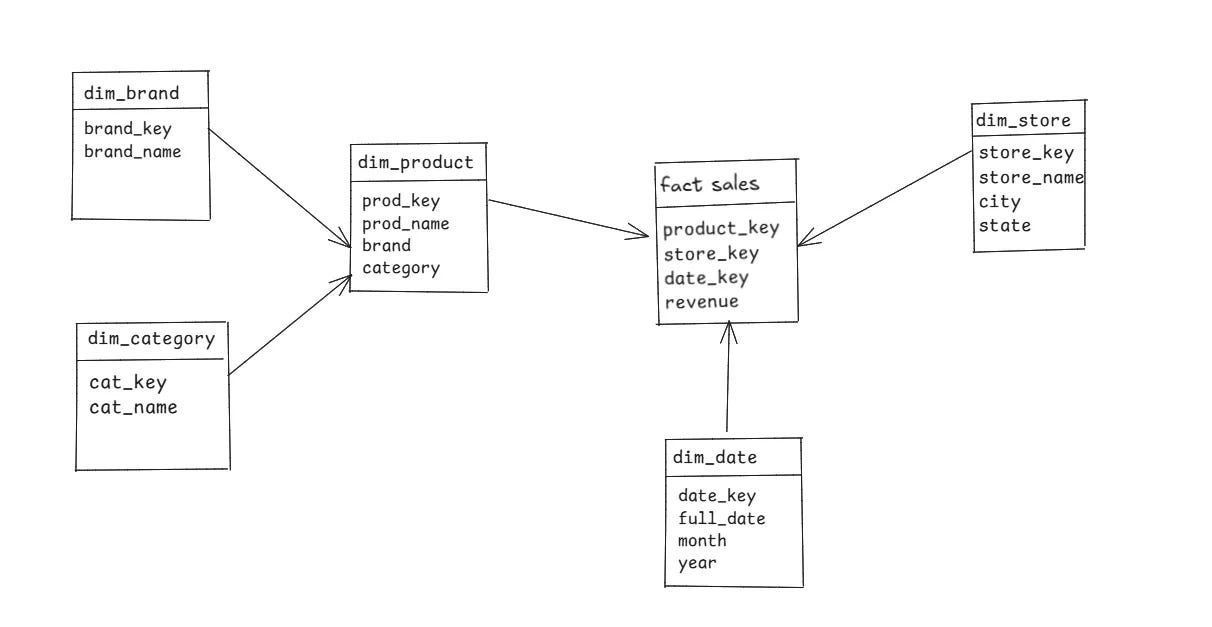
Now, to get the total revenue by each product_brand we need to join fact_sales table with the dim_product table, and then joining the dim_product table with the dim_brand table.
Why use a Snowflake Schema?
Less Redundancy & Storage: Normalization means you store information like “Electronics” or “Nike” only once, saving storage space.
Easier Maintenance: If a category name changes, you only have to update it in one place.
Major Drawbacks
Slower Queries: The biggest drawback. More tables mean more complex joins, which can significantly slow down query performance.
More Complex: It’s harder for analysts and BI tools to navigate the web of interconnected tables.
Best For: Scenarios with very large, complex dimension tables with many hierarchical levels (e.g., geographical data: Country -> State -> City -> Store).
The Galaxy Schema
What happens when you have more than one business process you want to analyze? For example, you want to look at both Sales and Shipping data. This is where the Galaxy Schema comes in.
It’s essentially a collection of multiple Star Schemas that share dimension tables. Because it looks like a collection of stars, it’s often called a Fact Constellation.
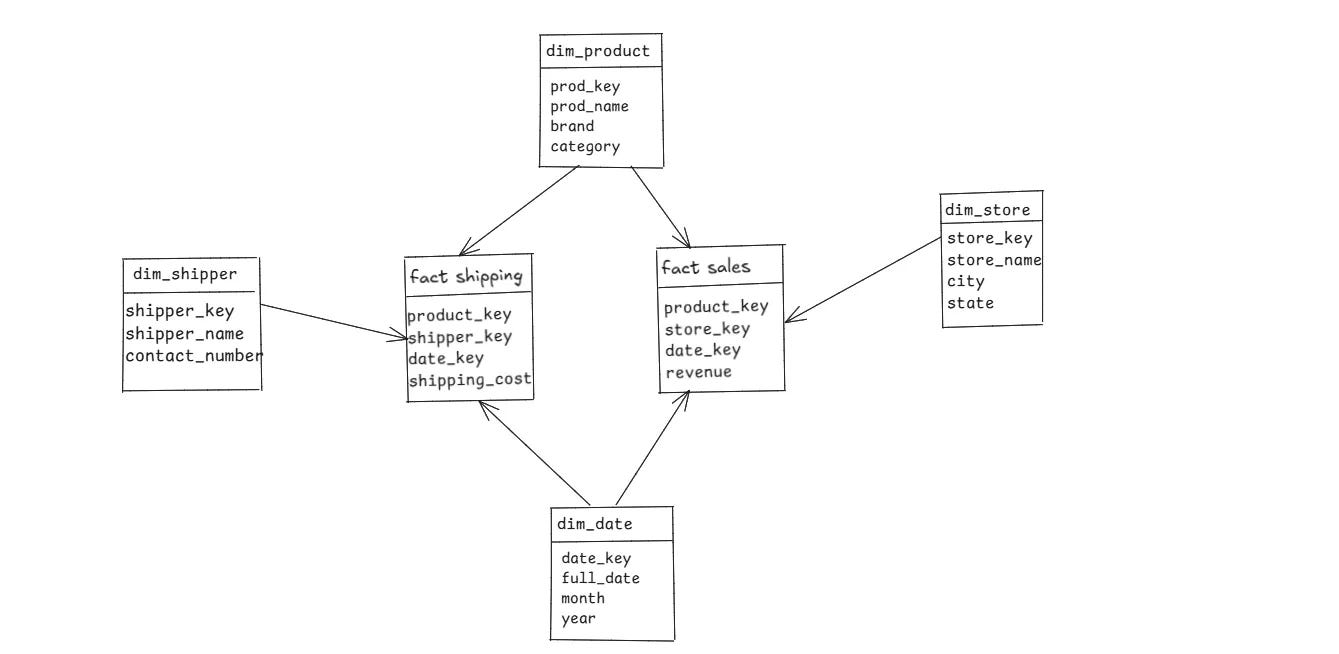
Here, dim_date and dim_product are conformed dimensions , they are shared between both fact tables, allowing you to analyze both processes using a common context. For instance, you could analyze the shipping_date for products in a specific category on a specific date.
Why use a Galaxy Schema?
Highly Flexible: It allows for sophisticated analysis across different parts of a business.
Reusable Dimensions: Promotes consistency by reusing dimensions across different models.
Drawback
Very Complex: This is the most complex schema to design, manage, and explain to business users.
Best For: Mature, enterprise-level data warehouses that need to integrate data from various departments (e.g., sales, finance, inventory, marketing) for a holistic view of the business.
Real-Life Scenarios
Amazon’s Data Warehouse
A Star Schema answers: How many iPhones were sold last week?
A Snowflake Schema answers: Which brands sold the most within each category, across different regions?
A Galaxy Schema lets you combine: For each iPhone sold last week, what was the average delivery time and shipping cost by city?
A Hospital network
A Star Schema answers a direct, high-level question about a single process: “How many cardiology patients were admitted in the last month?”
A Snowflake Schema answers a more detailed question by navigating through normalized dimensions: “For all patients diagnosed with Type 2 Diabetes, which primary care physicians have the highest number of referrals to specialist departments (like Cardiology, Neurology, etc.)?”
A Galaxy Schema lets you combine data from two separate business processes (like Patient Admissions and Pharmacy Billing) that share common dimensions (like Patient, Date, and Hospital Branch): “For patients admitted for cardiac surgery last quarter, what was the total cost of medication billed to them during their stay?”
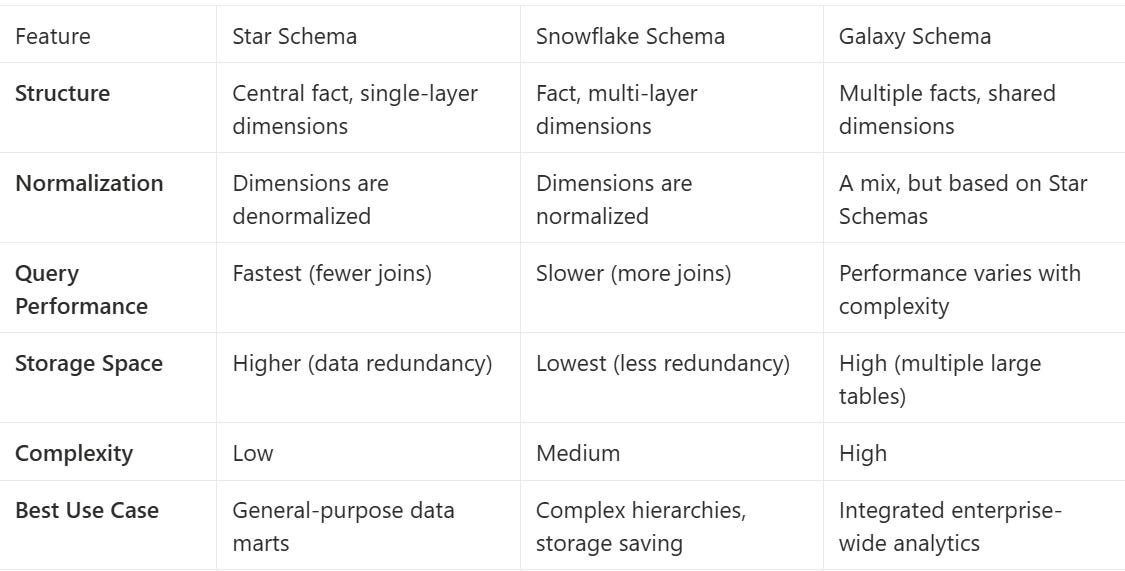
Quick Comparison Sheet
Red flags
Star Schema : Avoid if dimension tables are huge or change frequently.
Snowflake Schema : Avoid if query speed is your top priority.
Galaxy Schema : Avoid if your organization is small or data processes are simple.
So, what’s the big deal with schemas? It all comes down to this: a good schema puts your data on the offense. Instead of your team just reacting to old numbers, they can actively hunt for the insights that will actually help your business win. It’s not just a technical choice; it’s the foundation for real intelligence
Resources:
Documentation for Snowflake Tutorial : Click here